This section presents our analysis of the dataset and provides details to further explain our findings.
Research Question 1: Which video game genres have the most non-male character representation from 2012 to 2022?
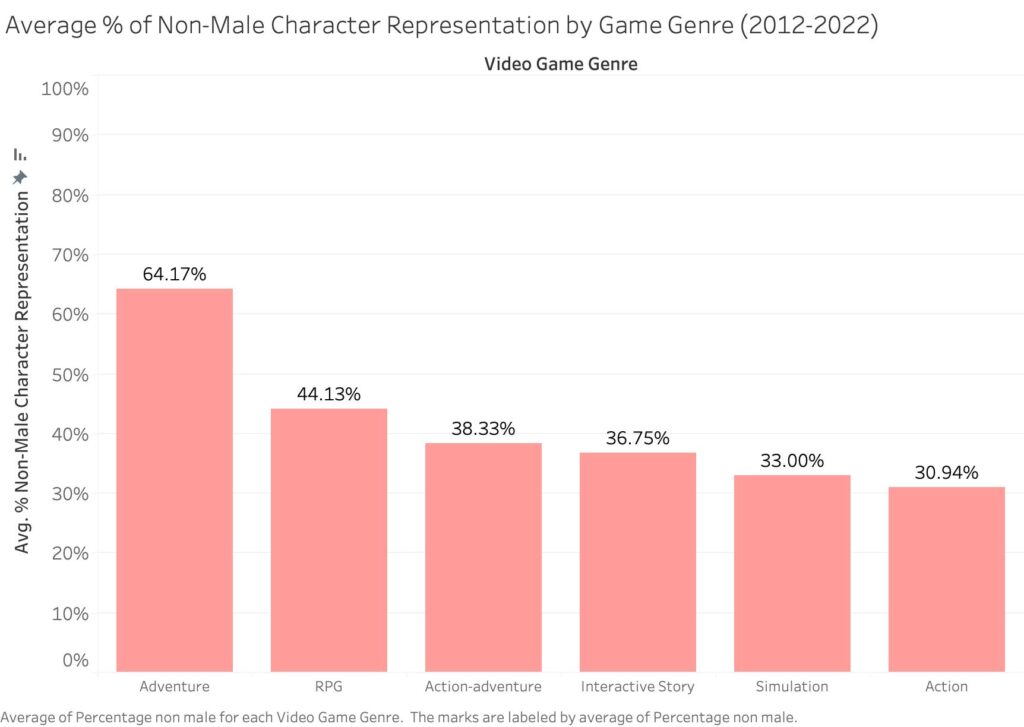
Figure 1
This data is based on 64 video games released by various gaming companies in the world from 2012-2022.
This bar chart (Figure 1) displays the proportion of characters that are non-male in different video game genres. In this scenario, non-male includes female, non-binary, and custom gender characters. Here, custom genders refers to characters whose gender is customizable (either male or female). In general, it is common perception that male characters are considered more prevalent in video games. However, based on our dataset, we can see there is a higher average percentage of non-male characters in some genres of video games. An important point to note is that this data refers to all types of playable characters, not protagonists.
For example, we can observe that there is an average of 64.17% of non-male characters existing in Adventure games. In contrast, the five other genres of RPG, Action-adventure, Interactive story, Simulation, and Action, have an average proportion ranging from 30 to 45% of playable non-male characters. Such data is useful for video games companies to review and create more equitable gender representation in certain genres of video games. By doing so, they will be able to create more diverse games which appeal to wider audiences.
Research Question 2: What is the diversity of character gender representations in video games during the past decade?
Figure 2
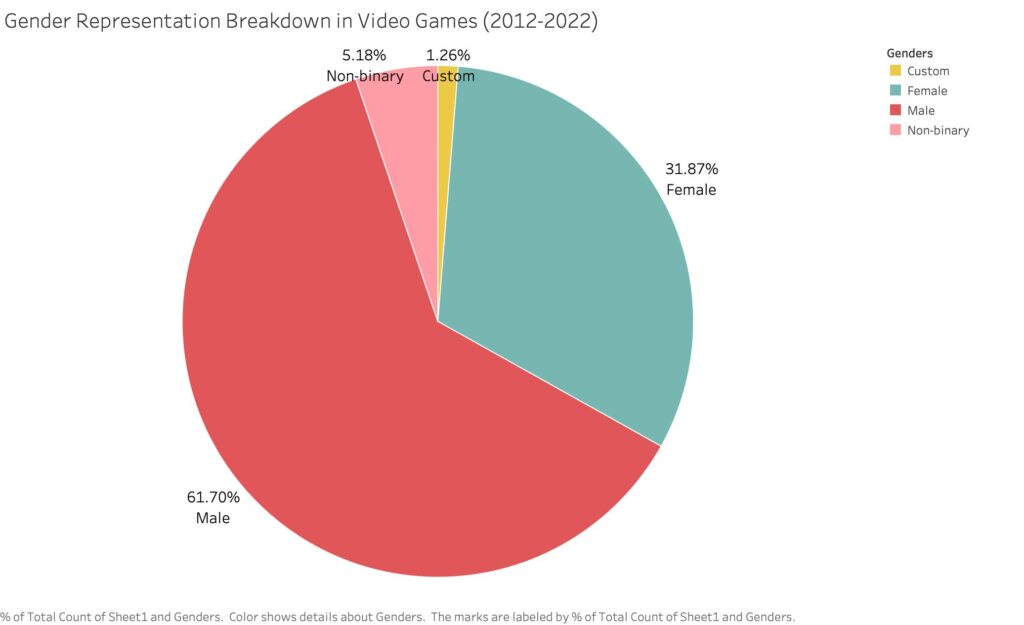
This pie chart (figure 2) demonstrates gender representation in video games such as which gender is most or least represented from 2012 to 2022. These genders apply to all species like humans, animated objects, animated plants, creatures, humanoid-animals, and robots. Out of a data set of 637 characters found in 64 games ranging over different genres, the data represents males, females, non-binary, and custom genders. Custom genders refers to characters that the game offers the option to customize their gender.
As the pie chart indicates, male characters in video games are almost double the number of female characters (~62% versus ~32%). Non binary and custom genders are an insignificant number. This pie chart depicts the gender imbalance in video games that are marketed by different video game companies from across the world and we can clearly see that the video games in our data set predominantly feature male characters. By reviewing a wide variety of video game genres like Adventure, RPG, Action/Adventure, we can see that there is still a common theme of male dominance throughout the characters in video games. This gender inequality trend may be seen as a reflection of the lack of diversity seen in media and entertainment.
Figure 3

To create the map, I used Tableau. The particular style of map I chose was a symbol map that allowed me to present quantitative data points by geographic location in an impactful way. This map demonstrates meaningful data about gender representation in video games based on geographical location. I created the map based on sample data pulled from 64 video games created by gaming companies across the globe. The map represents the % of non-male protagonists featured in these games. The more intense the color, the higher the value.
In this map, the top number displayed on the country indicated the total number of games in our data set from that country. The bottom number is the % calculated as the sum of non-male protagonists divided by total protagonists (any gender) for all the games in that country. This aspect is important in understanding gender bias in video game characters found all around the world. By examining the data, we can observe that games selected for Canada contain more non-male protagonists (57.14%) as compared to the games chosen for the US region (37.5%). For example, in countries such as Australia, Belgium, Denmark, and Finland only one game was part of the sample data set and it featured a non-male protagonist, for that reason, the map shows 100% for these three countries.
By reviewing such maps, we get a better understanding of the gender of protagonists and can identify opportunities to correct the gender bias in video game characters. The trend displayed in the map connects directly to the research published in the article “The Virtual Census: Representations of Gender, Race and Age in Video Games.” (Dmitri et al., 2009). The authors contend that male characters are systematically over-represented in video games and this gender bias can influence players’ perception of social reality.
Research Question 3: How does the ratio of female to male developers affect the sexualization of characters, and what is the trend observed in the diversity and inclusivity of character representations in video games over time?
Figure 4 and 5
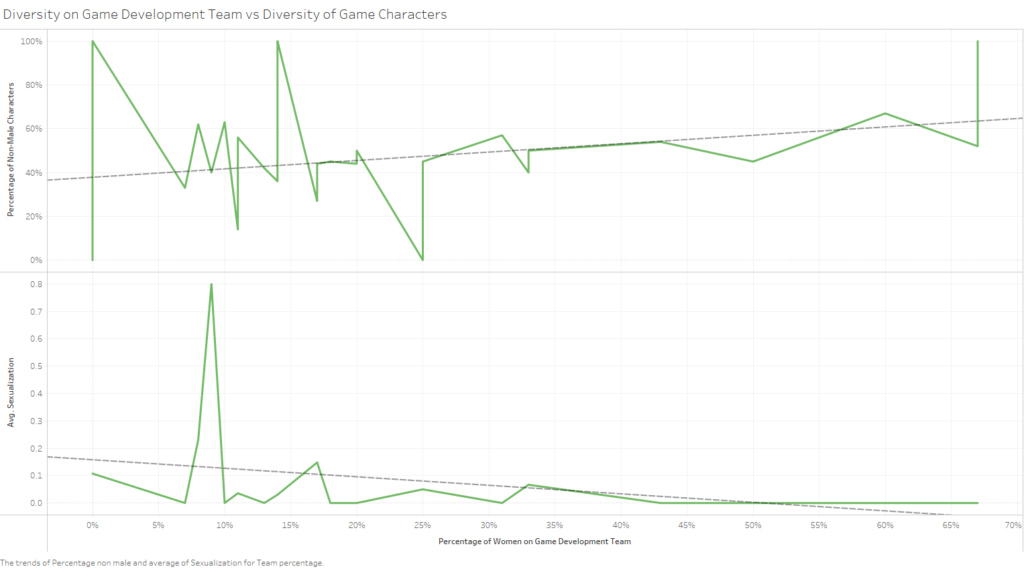
These two line charts (figure 4 and 5) plot the relationship between the diversity of game developers and the diversity of game characters. In this chart, the diversity of game characters was represented by the percentage of non-male characters in figure 4 and average sexualization scores. The diversity of the game development team was determined by the percentage of non-male members on the team (non male members/total members). It is likely that greater representation in the game development team will lead to a more fair representation of characters in the game.
Figure 4 is a line chart that showcases the relationship between two important aspects of the gaming industry: the diversity of game developers and the diversity of game characters. As we examine the data points and the trend line, we can observe a positive correlation between the two variables. This means that as the percentage of women on the development team increases, there is a corresponding rise in the proportion of non-male characters featured in the games they create. This finding suggests that having a higher representation of women on the development team positively influences the inclusion of diverse characters in video games.
Figure 5 examines the relationship between game developer diversity and character sexualization. It reveals that an increase in the percentage of women on the development team is associated with a decrease in the average sexualization of characters. This finding aligns with the broader research on the impact of diverse teams in creating more inclusive and representative character portrayals. However, there are also notable outliers, indicating instances where sexualized portrayals persist despite progress. There is a sharp spike at 9% women on the team, due to an unusually low number of characters in Super Mario Odyssey, with two of five characters earning sexualization scores of 2. These spikes warrant closer investigation to understand the factors influencing character sexualization in specific games. Overall, Figure 5 offers valuable insights into the ongoing efforts toward inclusivity in the gaming industry and highlights the significance of diversity in shaping character representations.
Figure 6

Figure 6 demonstrates the trend of increasing non-male protagonists in video games over the last decade. It plots the average nonmale protagonist of best-selling video games of each year, and charts it against its release date. Greater numbers of nonmale characters contribute to creating a more inclusive environment within the gaming community.
Here we can draw a trendline to illustrate that there is a consistent increase of nonmale protagonists over the years. This is consistent with the findings in “The Lara Phenomenon: Powerful Characters in Video Games” (Jansz and Martis 2007), which points to the trend of dominant female characters in video games, with a focus on games released in the early 2000s. Our data set extends those years from 2012-2022, showing that this trend is continuing to increase steadily.
As we analyze the trendline on the graph, we observe a gradual but steady incline, suggesting a positive shift in the industry’s approach to character representation. In 2012, the average percentage of non-male protagonists stood at a relatively lower level, indicating a prevalent gender disparity in game narratives. However, with each passing year, the data points show a progressive rise in the inclusion of non-male characters as central figures in gaming experiences.
This upward trajectory aligns with the growing recognition within the gaming industry of the importance of diverse and inclusive storytelling. Games with non-male protagonists provide players with fresh perspectives, breaking away from traditional gender stereotypes, and offering more authentic and relatable experiences. This trend reflects an ongoing effort by game developers to address the demand for more diverse and empowering narratives in video games.